layout: post published: true title: 2023-07-03-记录istio 不正常故障排查 categories: [document] tags: [mesh,istio,服务网格] —
现象
项目地址:https://github.com/zackzhangkai/showcase/tree/master/go-demo/review
安装 review和 rating 两个服务后,通过网关访问 review服务,一直访问报 502:
➜  ~ helm -n review install review  ./review-rating-chart

➜  ~ kubectl -n review get all
NAME                             READY   STATUS    RESTARTS   AGE
pod/mysql-5fb96d797b-8hzw5       1/1     Running   0          43m
pod/rating-v1-584dbcf444-kjsff   2/2     Running   2          43m
pod/review-58c45f8d7c-f45hj      2/2     Running   2          43m

NAME             TYPE        CLUSTER-IP     EXTERNAL-IP   PORT(S)        AGE
service/mysql    ClusterIP   None           <none>        3306/TCP       43m
service/rating   ClusterIP   10.233.5.150   <none>        8888/TCP       43m
service/review   NodePort    10.233.10.48   <none>        80:30125/TCP   43m

NAME                        READY   UP-TO-DATE   AVAILABLE   AGE
deployment.apps/mysql       1/1     1            1           43m
deployment.apps/rating-v1   1/1     1            1           43m
deployment.apps/review      1/1     1            1           43m

NAME                                   DESIRED   CURRENT   READY   AGE
replicaset.apps/mysql-5fb96d797b       1         1         1       43m
replicaset.apps/rating-v1-584dbcf444   1         1         1       43m
replicaset.apps/review-58c45f8d7c      1         1         1       43m

抓包:
# 看 pod 对应的节点及 docker
# 找 docker 的 pid
# 进 pid 的 ns 抓包:

tcpdump -i eth0 port 8080 -qenn
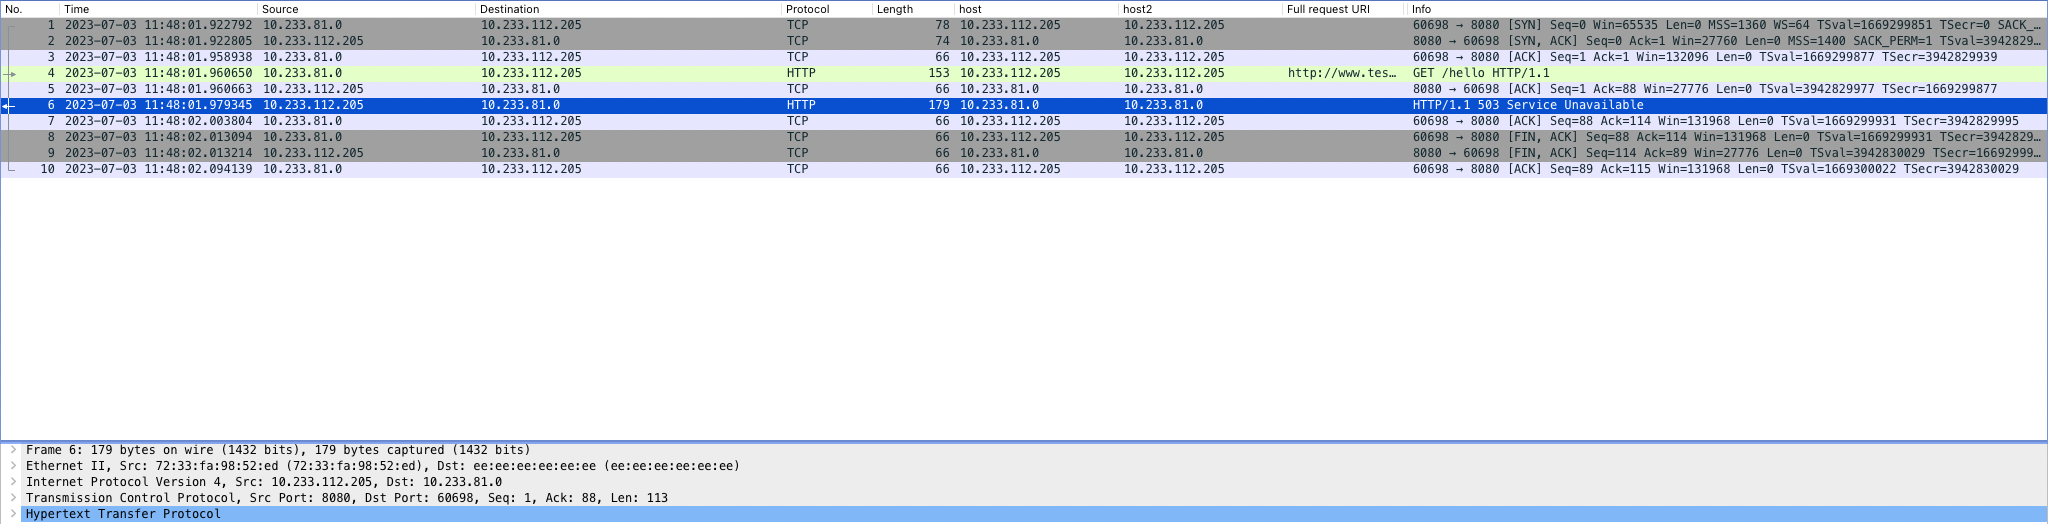
抓包看不出问题。很明显是应用层的问题,此时查 istio的配置项
# 配置日志 debug
- 开启端口 port-forward
k -n istio-system port-forward deploy/istio-ingressgateway 15000
- curl -XPOST “localhost:15000/logging 查看可配置项
➜  ~ curl -XPOST "localhost:15000/logging?upstream=debug"

active loggers:
  admin: warning
  aws: warning
  assert: warning
  backtrace: warning
  cache_filter: warning
  client: warning
  config: warning
  connection: warning
  conn_handler: warning
  decompression: warning
  dubbo: warning
  envoy_bug: warning
  ext_authz: warning
  rocketmq: warning
  file: warning
  filter: warning
  forward_proxy: warning
  grpc: warning
  hc: warning
  health_checker: warning
  http: warning
  http2: warning
  hystrix: warning
  init: warning
  io: warning
  jwt: warning
  kafka: warning
  lua: warning
  main: warning
  matcher: warning
  misc: error
  mongo: warning
  quic: warning
  quic_stream: warning
  pool: warning
  rbac: warning
  redis: warning
  router: warning
  runtime: warning
  stats: warning
  secret: warning
  tap: warning
  testing: warning
  thrift: warning
  tracing: warning
  upstream: debug
  udp: warning
  wasm: warning
- 开 debug
➜ ~ curl -XPOST “localhost:15000/logging?upstream=debug”
注:如果要全部开启 debug : curl -XPOST curl -XPOST 'http://localhost:15000/logging?level=debug'
看日志:
2023-07-03T04:12:02.106645Z	debug	envoy upstream	no healthy host for HTTP connection pool
2023-07-03T04:12:02.832519Z	debug	envoy upstream	no healthy host for HTTP connection pool
2023-07-03T04:12:03.375475Z	debug	envoy upstream	no healthy host for HTTP connection pool
2023-07-03T04:12:04.719624Z	debug	envoy upstream	no healthy host for HTTP connection pool
关键信息:
no healthy host for HTTP connection pool
分析:
到此,基本可以肯定是 envoy 数据面转发的问题。
envoy 的 xds 流程如下:
lds → rds → cds → eds
剩下的还有 sds,那是加密服务,根据返回结果,非 secret 的问题。
- lds 开启监听端口,如果有问题,会直接访问不通;
-
rds 会将流量路由至服务,有可能有问题。当配置有问题,一般是直接提示 404。但此处是 503,大概率不会是它的问题。我们看下环境上的信息:
➜ ~ istioctl pc r istio-ingressgateway-b96f848b7-zfdqr.istio-system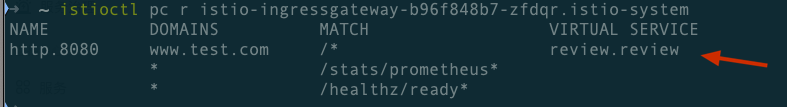
查看详细配置:
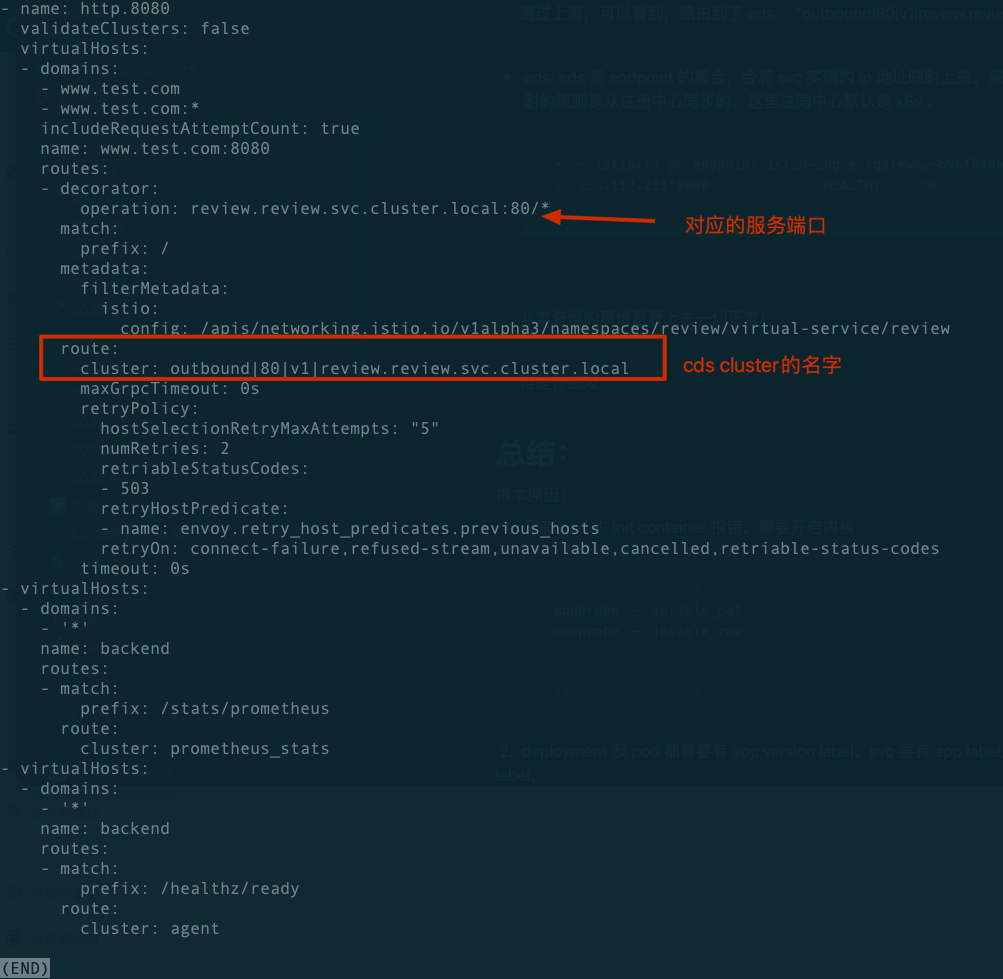
可以看到 cluster 名字为:
outbound|80|v1|review.review.svc.cluster.local -
cds: cluster 信息,设置的熔断等规则一般会在这里生效,看下环境上的配置
➜ ~ istioctl pc c istio-ingressgateway-b96f848b7-zfdqr.istio-system | grep review.review

看到这里有两条规则:第一条规则的意思是可以路由所有版本,下面这个是路由的具体版本。
我们路由的是带版本号的 cluster 。
查看详细配置:
➜ ~ istioctl pc c istio-ingressgateway-b96f848b7-zfdqr.istio-system --fqdn review.review -ojson | fx
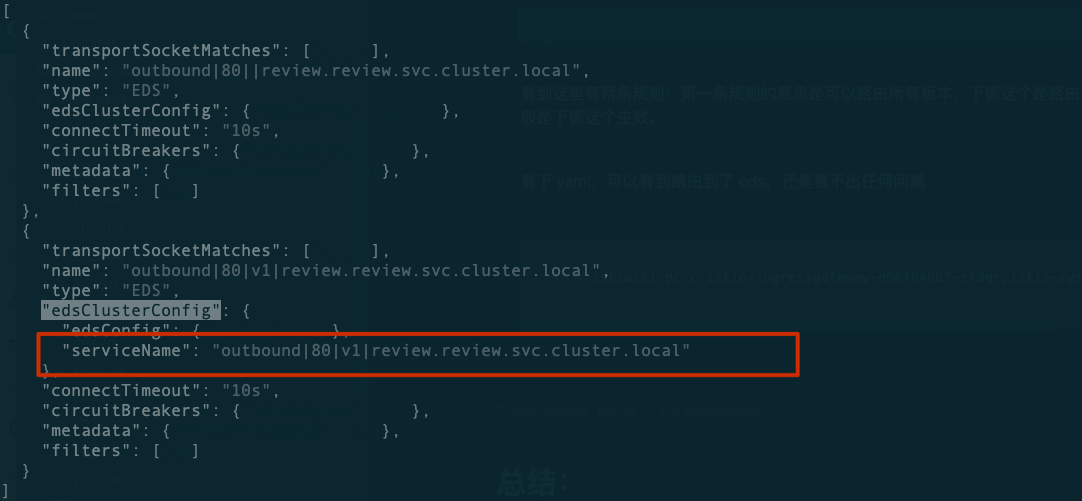
通过上面,可以看到,路由到了 eds "outbound|80|v1|review.review.svc.cluster.local"
-
eds: eds 是 endpoint 的集合,会将 svc 实例的 ip 地址映射上来。服务名与 endpoint ip 端口映射的规则是从注册中心同步的,这里注同中心默认是 k8s 。
  ➜  ~ istioctl pc endpoint istio-ingressgateway-b96f848b7-zfdqr.istio-system | grep review.review
  10.233.117.211:8080              HEALTHY     OK                outbound|80||review.review.svc.cluster.local
解释下这个命令输出的意思:第一列是 enpoint 地址,即 pod 的 ip,第二列和第三列是该端口的健康状况。每个 endpoint 都会自动被 envoy 检查。最后一列是 对应的 cluster name。
那么问题出现了:为什么没有看到对应版本号的 cluster ?
总结:
根本原因:
deployment 及 pod 都需要有 app,version label。svc 要有 app label。这里 pod 掉了 version label。

mesh 几个需要注意的点:
- istio 需要开启内核 iptables,否则sidecar pod 的 init container 报错。
开启内核:
# cat /etc/sysconfig/modules/iptable.modules
modprobe -- iptable_nat
modprobe -- iptable_raw

# 执行开启,而且开启后会自动生效
]# sh /etc/sysconfig/modules/iptable.modules
- label 相关:deployment + pod (app,version), svc (app) 。且 app label 要与 svc 的名字一致。
- svc 的 端口名字要以 http或是 grpc 等协议开头,新版本也只可以使用 k8s svc的 protocol 字段,但是兼容起见,以 name 的名字开头更好。
- istioctl 也有 bug,可以使用 i9s 查看 envoy 的配置,效果更直观。当然,通过访问 envoy 15000管理端口获取配置,也是思路,但是配置项太多不容易看过来。
附:这里有一篇好的 istio 系统文章:
https://istio-insider.mygraphql.com/zh_CN/latest/ch2-envoy/envoy%40istio-conf-eg.html
https://blog.mygraphql.com/zh/posts/page/3/ 宝藏博主,值得学习。